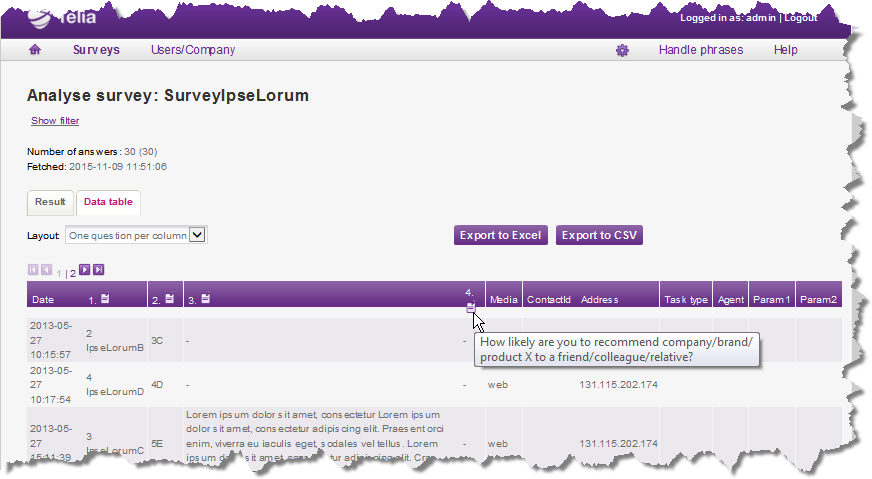
 option for a selected survey, can be transferred to data files. See Basics about Analyse. When you click on an export button you just have to point to where the file is to be saved and you change the file name, if necessary.
The reply results, shown after opening the Analyse  option for a selected survey, can be transferred to data files. See Basics about Analyse. When you click on an export button you just have to point to where the file is to be saved and you change the file name, if necessary.
Under the Data table tab you have the option of Export to CSV (Comma-Separated-Values), which can be used in programs with different file format standards, or to Export to Excel, which requires Microsoft Excel to be installed on your computer.
What is exported when you click on Export to Excel is what you see on your screen. When exporting data the sequence of the columns is not exactly alike but if you on the Result tab have a view with a pie or bar chart open, the Excel file will contain the same picture presentation. If you do not see the pie and bar charts in your Excel spreadsheet after export, you may have to accept the use of macros.
The content of the data table can be limited by your specifying values under the Show filter option, above the Result and Data table tabs.
You can also transfer data after searching amongst all survey answers. See Search data in company
Under the Data table tab you see the result of all the questions in the survey, with data set up as in a file after export. Under the data table you can, with  , choose whether you want to see the questions and available answers at the bottom of the page. However, these are not seen in the export file.

For Layout you select, in a drop-down menu, how you want to sort your table. One question per column, seen above, or One answer per column.
A text that is too long to be presented in full on the web page can be spoken if you move your mouse pointer over the relevant field. Via notice icons  you can see for example, the answers to free text questions and the question text.
This is a description of the columns in the various layouts