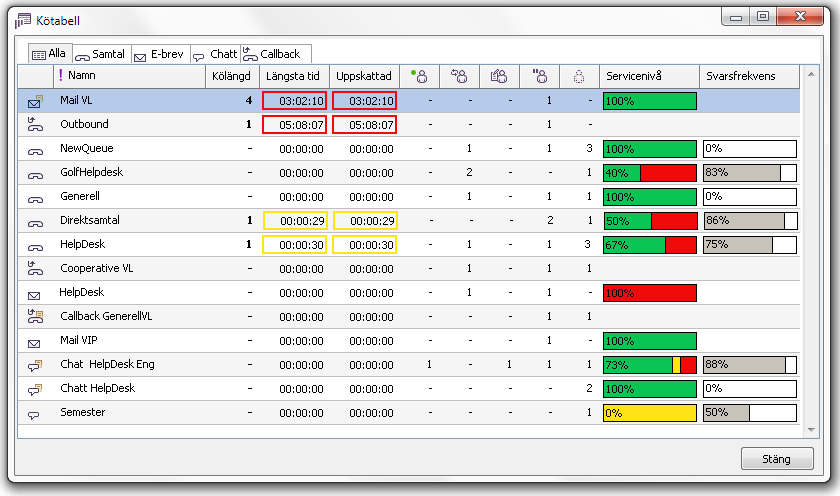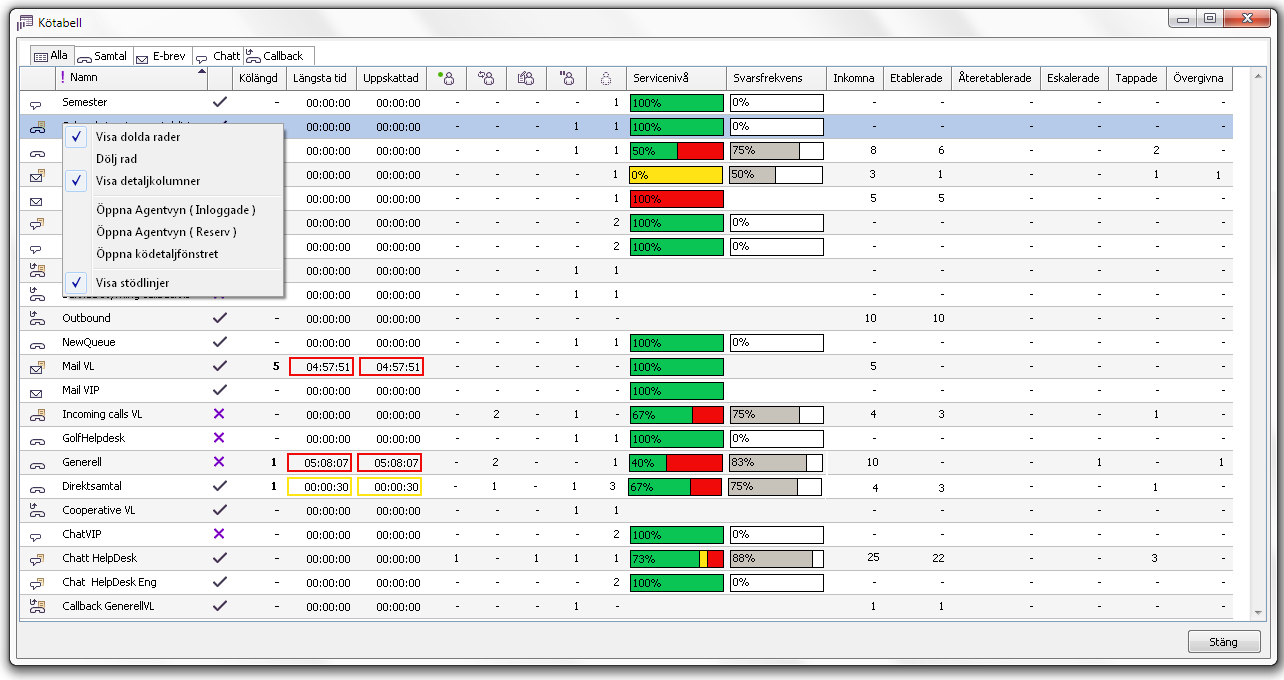
In order to quickly see whether a queue is out of crew, has become too long or does not meet the requirements for service levels, you can use the window where you get an overview of all queues; Queue table.
As usual in ACE Pulse you first select organisation area in the main window. In the Queue table window you then specify whether you want to see data for All queues and waiting lists included in your access rights, or for a specific media.

You can choose whether you want to view the queues in a specific order, such as from Longest queue time or queue length. You change the order by clicking on the title of the column you want to sort by. A triangle after the title name then indicates which column you have sorted by.
In the Queue table window, you see the following, per queue and waiting list respectively:
|
|
The icon for media type and distribution. |
| Name | Queue or waiting list name. |
| Queue length | Number contacts currently in queue. |
| Longest queue time | Calculated on a running basis each time a contact arrives or leaves the queue, from the time when the contacts required routing the first time.
The field is coloured when the service level is low compared with the threshold specified in ACE Admin. When the queue time of waiting contacts have exceeded the threshold for service level 1, you see a yellow frame and when the queue time has exceeded the threshold for service level, the frame turns red. |
| Estimated | An estimated value for queue time for the contact currently at the end of the queue. The value is based on the queue length and how long the queue time has been for earlier contacts in the queue (EQT). These fields are also coloured as above. |

|
Number of ready agents. |

|
Number of agents in contact. |

|
Number of agents in wrap-up. |

|
Number of paused agents. |

|
Number of extra agents. |
| Service level | How service requirements for service levels 1 and 2 are fulfilled in %. Green, yellow and red colours show whether and to what extent the various service levels have been exceeded. |
| Answer rate | Service levels constitute a way of measuring how good the service provided by the queue is, but then just time is measured, that is, how soon a call is answered. If you measure the answer rate you can see how good service the queue is providing, seen the availability. If many calls hang up before they are answered, the answer rate goes down. Here you see answer rate in % for the queues and waiting lists distributing incoming calls and chats, the formula used to calculate the answer rate is:
(Established + Reestablished) / (Established + Reestablished + Lost + Abandoned) |
You can hide queues in the window. Select the row for the queue you want to hide and then right-click to open a menu. There you select Hide row. If the View hidden rows menu choice is ticked, you see the hidden queue with a ![]() . The queues you still want to be visible are seen with a
. The queues you still want to be visible are seen with a ![]() . To no longer view the hidden rows, you untick View hidden rows. You can also hide rows by selecting View hidden rows in a context menu and then double-click directly on the symbol that is then changed.
. To no longer view the hidden rows, you untick View hidden rows. You can also hide rows by selecting View hidden rows in a context menu and then double-click directly on the symbol that is then changed.
An exclamation mark ![]() to the left of the Name title then indicates that there are hidden queues or waiting lists.
to the left of the Name title then indicates that there are hidden queues or waiting lists.
Via the context menu you can also open the Agents window, with various views preset, per selected queue/waiting list. The Agents window is described in section Basics about the Agents window. Via the context menu you can also open the queue detail window described in section See today’s queue status in queue detail window and choose to view or hide the grid lines in the queue table.

Via the context menu you can also choose to View detail columns. The extra information fields then open display the following data items for each respective queue or waiting list: